 how-to
5 Steps to Warehouse Labor Cost Reduction
Last Updated: October 23, 2026
Quick Summary
Achieve warehouse labor cost reduction in five steps: build a labor cost baseline before cutting anything, measure productivity at the task level, fix layout and picking before buying robots, rebuild scheduling around demand, and run automation ROI before signing. Cutting headcount before you have a baseline usually raises cost per order.
- Run your baseline for a full quarter, since a single good week tells you nothing.
- Order picking is commonly cited as the largest share of warehouse labor hours.
- Slot highest-velocity SKUs between roughly knee and shoulder height in the golden zone.
- Overtime is a symptom, not a cause: fix the schedule and overtime usually shrinks.
- If payback stretches past two years at current volume, wait and grow into it.
Table of Contents
- Step 1: Build a Labor Cost Baseline Before You Cut Anything
- Step 2: Measure Warehouse Labor Productivity at the Task Level
- Step 3: Fix Layout, Storage Density, and Picking Before You Buy Robots
- Step 4: Rebuild Warehouse Workforce Scheduling Around Demand, Not Habit
- Step 5: Run Warehouse Automation ROI Before You Sign a Contract
- How to Track Warehouse Labor Cost Per Order After the Changes Land
- Frequently Asked Questions
Step 1: Build a Labor Cost Baseline Before You Cut Anything
Most warehouse labor cost reduction starts with a layoff and ends with a service failure. You cannot reduce what you never measured, and labor cost reduction without a baseline is just guessing with people's paychecks.
Start with your total labor spend across every category: base wages, overtime, temporary agency markup, benefits, and supervisor time. Then divide it by real output.
The Metrics That Belong in Your Baseline
Pull these before you change a single process:
- Cost per order shipped (total labor spend ÷ orders)
- Cost per unit handled (labor spend ÷ units picked, packed, or received)
- Orders per labor hour by function, not just site-wide
Run this for a full quarter. A single good week tells you nothing.
Step 2: Measure Warehouse Labor Productivity at the Task Level
Site-wide averages hide where the money actually leaks. A warehouse can look healthy overall while one function quietly burns hours.
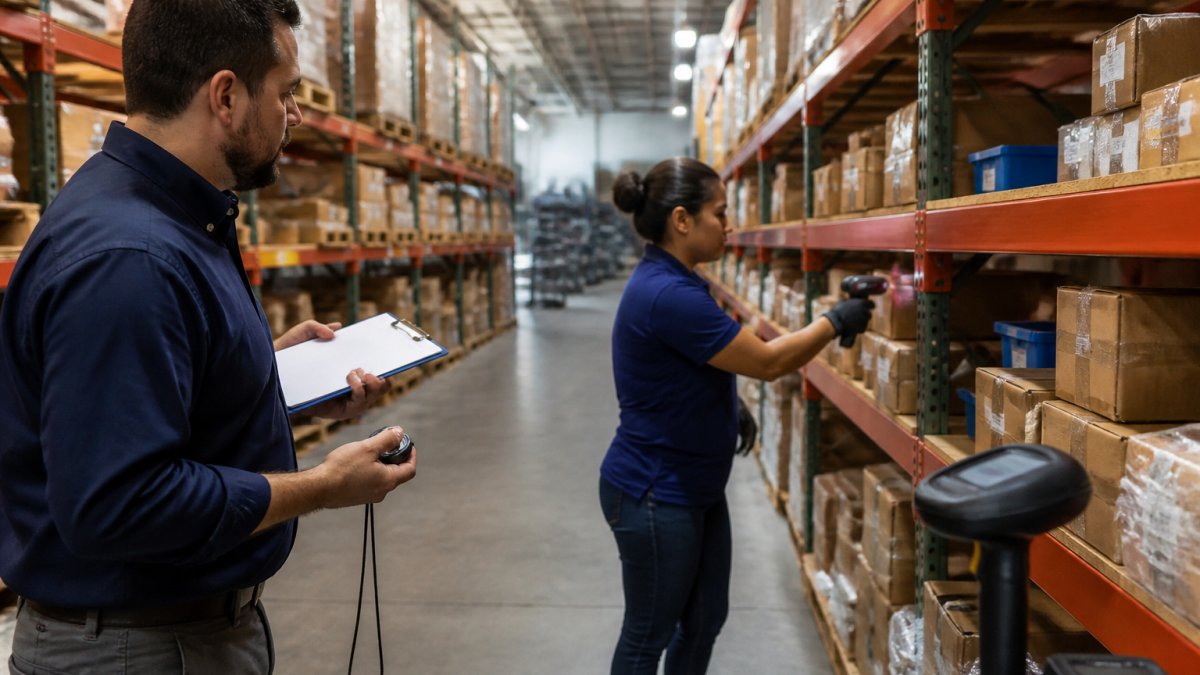
Break the day into functions: receiving, putaway, picking, packing, and shipping. Time each one separately. Then track lines picked per hour, picks per hour, and picking accuracy per function.
For a deeper walkthrough of task-level measurement, see our guide on how to improve warehouse labor efficiency.
Step 3: Fix Layout, Storage Density, and Picking Before You Buy Robots
The cheapest savings come before you spend a dollar on equipment. Warehouse layout, space use, and storage density shape how far people walk, and walking is pure cost. Order picking is the most labor-intensive function in most operations, commonly cited as the single largest share of warehouse labor hours, so it deserves the first hard look.
Quantify Travel Before You Redesign Anything
Walk a picker's route yourself with a stopwatch and a tape measure. Most practitioners find travel time eats the largest share of the pick cycle, often more than picking, packing, or searching combined. Do the math in feet, not feelings:
- Measure average feet traveled per pick line on your current route.
- Multiply by lines picked per shift to get feet per shift.
- Divide by walking speed (a common planning assumption is roughly 3 feet per second loaded, slower with a cart or pallet jack) to get hours spent walking.
That number is your budget for layout and slotting changes. If a re-slot costs less than one year of travel waste, it pays back inside a year.
Slotting Mechanics That Actually Move the Number
Slotting is not "put fast movers near the dock" as a slogan, it is a repeatable rule set:
- Velocity slotting: Rank SKUs by picks per day, not units shipped. A slow-moving pallet of small parts can generate more pick lines than a fast-moving full-case item.
- Golden zone: Place the highest-velocity SKUs between roughly knee and shoulder height to cut bend and reach time. Reserve floor and top levels for palletized, low-touch inventory.
- Affinity grouping: Put SKUs frequently ordered together in the same zone so one pass covers more order fulfillment lines. Pull order history and look for pairs that co-occur above a threshold you set.
Storage Density Is a Trade-Off, Not a Free Win
Higher storage density cuts square footage and travel distance, but it can raise pick time per line. Narrow aisles, high racking, and deep-lane storage all trade access speed for capacity. Before you densify, ask:
- Does the denser layout force slower equipment (narrow-aisle reach trucks, order pickers) that raises labor hours per pick?
- Does deeper storage increase replenishment touches or make FIFO harder?
- Does the cube gain offset the pick-rate loss at your actual order profile?
Run the comparison on cost per line picked, not cost per square foot. A layout that saves rent but adds two seconds per pick can lose money at volume.
Match the Picking Method to the Order Profile
Picking method is a labor decision as much as a layout decision:
- Discrete picking, one order at a time. Simple, but travel-heavy at high line counts.
- Batch picking, one picker collects the same SKU for multiple orders in one pass. Cuts travel when many orders share SKUs.
- Zone picking, pickers stay in a zone and orders pass between them. Reduces travel but adds handoff and consolidation labor.
There is no universal winner. The right method depends on lines per order, SKU overlap, and order size. Test one change at a time against your Step 2 task-level baseline so you can attribute the savings.
Cut Search Time With Labels and Consistency
Search time is invisible waste. Fix it with clear labels, consistent storage systems, and a location scheme that a new hire can learn in a day.
Move the layout before you move the budget. A better route beats a new robot on cost almost every time, and it is reversible if the data says you guessed wrong.
Match the picking method to your order profile, since each one trades travel against consolidation labor differently.
| Picking method | How it works | Best for |
|---|---|---|
| Discrete picking | One order at a time | Simple operations, low line counts |
| Batch picking | One picker collects same SKU for multiple orders | Many orders sharing SKUs |
| Zone picking | Pickers stay in a zone, orders pass between them | Reducing travel, accepting handoff labor |
| Cluster picking | Picker carries multiple order totes, picks into each | Small, multi-line orders |
Step 4: Rebuild Warehouse Workforce Scheduling Around Demand, Not Habit
Most schedules are inherited, not designed. Shifts start at the same time every day because they always have. Warehouse workforce scheduling should follow your actual workload, not the calendar.
Pull your order volume by hour and by day. Compare it to your staffing curve. You'll usually find two problems: too many people during slow windows, and too few during peaks, which drives overtime and temporary labor spend.
Build the schedule around demand. For teams moving to demand-based scheduling, our guide on AI scheduling software for 3PL warehouses covers how the tools work. If you're weighing whether prediction is realistic for your volume, read can AI predict warehouse labor needs.
Cutting Overtime Without Cutting Throughput
Overtime is a symptom, not a cause. Fix the schedule and the overtime usually shrinks on its own. Set a firm cap, track it weekly, and review any shift that hits it. Throughput holds when the plan matches the work.
Step 5: Run Warehouse Automation ROI Before You Sign a Contract
Automation can cut labor costs, but only if the payback math works. Most vendors sell headline savings; your job is to build the model yourself before the sales call, not after. This is the step most cost-reduction guides skip, and it is where the money is won or lost.
Build the Full Cost Side, Not Just the Invoice
Equipment price is the smallest part of the number. Include every category that hits the P&L:
- Capital cost: purchase price, freight, rigging, installation, and integration with your WMS.
- Recurring cost: software licenses, service contracts, spare parts, and consumables.
- Facility cost: power, floor reinforcement, charging infrastructure, and any lost cube from the equipment footprint.
Add these into a total cost of ownership over the asset life, not just year one.
Build the Savings Side From Your Baseline
Use the Step 1 and Step 2 numbers, not vendor estimates. Savings come from four places:
- Hours eliminated: tasks the equipment removes entirely (hours per week × fully loaded wage).
- Hours redeployed: labor shifted to higher-value work, which only counts as savings if you actually reduce headcount or avoid a planned hire.
- Overtime and agency reduction: peak coverage the equipment absorbs.
Be honest about redeployment. If the hours move to another task and headcount stays flat, the savings are soft.
The Payback Formula and the Volume Trap
Payback period = total cost of ownership ÷ annual net savings. Run it at three volume levels: your current volume, a realistic growth case, and a downside case.
A common pattern is that payback stretches past two years at current volume but falls under two years once volume grows 20-30%. If that is your situation, the decision is timing, not yes or no.
A Decision Gate You Can Defend
Before signing, require the model to pass four tests:
- Payback inside your hurdle period at current volume, or a credible path to it within your planning horizon.
- Savings tied to measurable KPIs from Step 1, cost per order, cost per unit, lines per labor hour, not vendor percentages.
- Ramp-up risk quantified: how many weeks to full productivity, and what the savings look like during ramp.
- Exit and scale path: can you add capacity in modules, or are you locked into a single large bet?
If payback stretches past two years at your current volume, wait. Grow into it. Before you commit, review our automation alternative guide to see how the options compare.
How to Track Warehouse Labor Cost Per Order After the Changes Land
Savings evaporate without tracking. Warehouse labor cost per order is the number to watch, reviewed weekly against your Step 1 baseline. Watch cost per unit and cycle time alongside it.
Track a few things that protect the gains:
- Picking accuracy and throughput weekly
- Overtime and agency hours by shift
- Workplace safety incidents and absenteeism
For ongoing tuning after the changes land, see our AI recommendations for warehouse efficiency guide.
Cutting warehouse labor cost without breaking service is a measurement problem first and a spending problem second. Scale Partners AI builds production-ready systems that plug into your existing stack, with no rip-and-replace.
Frequently Asked Questions
How can warehouses reduce labor costs without cutting headcount?
Cut the work, not the people. Start by baselining cost per order and lines picked per hour, then attack travel time through slotting and layout changes. Rebuild warehouse workforce scheduling so shifts match actual order volume instead of a fixed pattern, which trims overtime and temporary labor spend. Add automation only after those process gains are captured, and run the payback math first. Most operations find 10 to 20 percent of labor hours sit in motion and rework rather than productive picking, so the savings usually come from the work itself.
How do you calculate warehouse labor cost per order?
Divide total labor spend for a period by the number of orders shipped in that same period. Include hourly wages, overtime premium, temporary agency markup, benefits load, and supervisor time allocated to the floor. Exclude one-off capital projects so the number stays comparable month to month. Track it weekly rather than quarterly, because a single bad week of overtime or a demand spike gets buried in a quarterly average. Segment by channel or order type if your mix varies, since a 12-line wholesale order and a 2-line direct-to-consumer order carry very different picking costs.
What percentage of warehouse operating costs is labor?
Labor is typically the single largest controllable line in a warehouse budget. The exact share depends on your automation level, order profile, and wage market, so calculate it from your own general ledger rather than borrowing an industry figure. Pull total labor spend, divide by total operating cost, and track the ratio over several months. A rising ratio usually signals falling throughput per hour, not rising wages, which points you toward productivity work rather than a hiring freeze.
Can warehouse automation reduce labor costs enough to justify the investment?
It can, but only after you have removed the waste automation cannot fix. Calculate warehouse automation ROI by taking the annual labor hours the system displaces, multiplying by your fully loaded hourly rate, and comparing that to total cost of ownership across a five-year horizon, including integration, maintenance, and training. Systems that automate a task you have not yet standardized tend to underdeliver, because the process variability gets baked into the equipment. Sequence matters: fix slotting and scheduling first, then automate the remaining repetitive motion.