 listicle
AI Tools for SKU Profitability Tracking: 2026 Guide
Table of Contents
- Quick Comparison: Top AI Tools for SKU Profitability Tracking
- How to Calculate Per SKU Profitability: A Step-by-Step Guide
- SKU Rationalization Best Practices for Operations Teams
- AI-Driven Demand Forecasting Tools: What to Look For
- Singuli: Deep Inventory Intelligence for Ecommerce Brands
- Competera: Dynamic Pricing Optimization at Scale
- Zoho Inventory: Affordable Entry Point for SMBs
- Fuelfinance: Financial Planning with SKU-Level Profitability
- Frequently Asked Questions
Last Updated: September 12, 2026
Quick Comparison: Top AI Tools for SKU Profitability Tracking
SKU profitability tracking measures the true margin each product variant delivers after every cost is applied. This guide from Scale Partners AI examines the AI tools that make that measurement automatic.
Most operations teams can tell you their total margin. Far fewer can name the ten SKUs quietly dragging it down. A product that looks healthy at the catalog level can lose money on every unit once pick costs, storage, and returns are allocated properly.
Quick Picks:
- Best Overall: Scale Partners AI, custom systems built around your existing stack, with weekly recommendations you can act on
- Best for Inventory Intelligence: Singuli, deep SKU-level demand and margin modeling
- Best Budget Entry: Zoho Inventory, real-time tracking from $29/month
- Best for Pricing Strategy: Competera, dynamic price recommendations across large catalogs
| Tool | Free Tier | Starting Price | Best For | Standout Feature |
|---|---|---|---|---|
| Scale Partners AI | No | Custom quote | Multi-channel operators | Weekly fix-this recommendations |
| Singuli | No | Contact for pricing | Ecommerce brands | SKU-level profitability analysis |
| Competera | No | Contact for pricing | Large catalogs | Real-time competitor monitoring |
| Zoho Inventory | Yes | $29/month | SMBs | Zoho ecosystem integration |
| Fuelfinance | No | Contact for pricing | Growth-stage SMBs | Cash flow forecasting |
| Prisync | No | $99/month | Competitive positioning | Dynamic pricing rules |
| Teamwork | Yes | $9.99/user/month | Project-based work | Profitability forecaster |
How to Calculate Per SKU Profitability: A Step-by-Step Guide
Per-SKU profitability is calculated by subtracting all direct and allocated costs from net revenue for each variant, then dividing by units sold to get margin per unit. The hard part is allocation, not arithmetic.
Here is the workflow that holds up in practice:
- Pull net revenue per SKU after discounts, returns, and marketplace fees
- Assign landed cost including freight, duties, and inbound handling
- Allocate variable costs (pick, pack, ship, payment processing) by actual usage, not averages
- Allocate fixed overhead (warehouse space, software, labor) using a defensible driver such as cubic volume or picks per SKU
- Calculate contribution margin per unit and in total
- Rank every SKU and flag the bottom decile for review

What most guides miss is step four. Teams that allocate overhead by revenue share rather than by physical driver routinely misjudge which SKUs are profitable. A bulky, low-price item can look fine on a revenue-based allocation and still lose money on space alone.
Key Metrics That Drive True Per-SKU Profit
Gross margin per unit tells you whether a product is worth selling. Inventory velocity tells you whether it is worth holding. Track these five:
- Contribution margin per unit, net revenue minus all variable costs
- Inventory turnover, cost of goods sold divided by average inventory value
- Inventory carrying cost, storage, insurance, shrinkage, and capital tied up
- Stock accuracy, the gap between system counts and physical counts
- Sell-through rate, units sold as a share of units received
Monitoring these five surfaces problems early. A SKU with healthy margin and slow velocity is a cash trap, not a winner (sba.gov).
SKU Rationalization Best Practices for Operations Teams
SKU rationalization is the disciplined process of cutting, keeping, or bundling products based on profitability and strategic fit rather than gut feel. Done well, it reduces overhead costs and frees working capital without hurting the customer experience.
The mistake most teams make is treating rationalization as a one-time purge. It works better as a recurring review tied to your reporting cycle: a quarterly cut list paired with a monthly flag for SKUs that cross a threshold on margin or velocity.
Data hygiene decides whether any of this works. If your channel-level analysis lumps three marketplaces into one revenue line, you cannot see that a SKU is profitable on one channel and loss-making on another.
When to Cut, Keep, or Bundle a SKU
Use this decision framework at each review:
| Signal | Action | Why |
|---|---|---|
| Negative contribution margin, low volume | Cut | Costs more to hold than it earns |
| Positive margin, low velocity | Bundle or reprice | Frees space without losing the sale |
| High margin, high velocity | Keep and protect stock | Core profit driver |
| Thin margin, high return rate | Investigate or cut | Returns often erase the margin (nrf.com) |
| Low margin, strong attachment rate | Keep | Drives sales of profitable items |
The Cost-Benefit Question: When Does AI Beat a Spreadsheet?
This is the question most rationalization guides skip, and it decides whether you buy anything at all. AI tools for SKU profitability tracking are not free, and for a small catalog the math does not always favor them. Compare the annual subscription cost against the labor hours your team spends on manual SKU analysis, plus the margin recovered from decisions you would not have caught by hand.
When a spreadsheet is still the right answer:
- Fewer than roughly 200 active SKUs, single sales channel, stable demand
- One person owns the analysis and can refresh it monthly without strain
- Cost allocation is simple enough that a pivot table captures it
When AI starts to pay for itself:
- More than a few hundred SKUs, or SKUs spread across multiple channels and locations
- Cost allocation requires per-order or per-pick data that a spreadsheet cannot refresh fast enough
- Demand shifts fast enough that a monthly refresh leaves money on the table
- The team is already spending meaningful hours per week reconciling exports
The break-even is rarely about the subscription price alone. It is about the cost of the manual layer: the analyst hours, the reconciliation errors, and the decisions made a month late because the report was not ready. A tool that costs a few hundred dollars a month but eliminates ten hours of analyst time and surfaces one mispriced SKU per quarter usually clears its own cost. One that only produces a dashboard nobody acts on does not.
Data Hygiene Before You Feed the Model
AI is only as good as the data underneath it. Before any rationalization review, confirm four things:
- One SKU, one identifier. Channel-specific SKUs mapped to a single internal record.
- Costs are current. Landed cost, freight, and duty rates change; stale costs produce false profitability rankings.
- Returns are attributed. A SKU with a high return rate looks profitable until returns are netted out.
- Allocation drivers are defensible. Cubic volume, picks per SKU, or storage days, not revenue share.
Teams that skip this step and buy a tool anyway usually pay for a faster way to produce the same wrong answer.
AI-Driven Demand Forecasting Tools: What to Look For
AI-driven demand forecasting tools predict future unit sales per SKU by learning from historical sales trends, seasonality, promotions, and external signals. The output feeds replenishment, so forecast quality directly determines how much capital sits in stock (apics.org). But the forecast is only as good as the pipeline that feeds it, and the pipeline is where most evaluations go wrong.
Evaluate any forecasting tool against these criteria:
- Granularity, does it forecast at SKU-by-location level, or only in aggregate?
- Data ingestion, can it read your existing order and inventory systems without a rebuild?
- Promotion handling, does it separate baseline demand from promotional spikes?
- Stock-out prevention, does it flag reorder points dynamically as velocity shifts?
- Explainability, can you see why the model recommends a given order quantity?
- Write-back capability, can it push a recommended order quantity into your purchasing system, or does it only display it?
The Integration Workflow Nobody Documents
Most articles describe what AI forecasting does. Very few explain how the data actually moves. Here is the integration pattern that holds up in production, whether you run NetSuite, Microsoft Dynamics 365, SAP Business One, Shopify, or a POS system like Square or Lightspeed.
Step 1: Extract. Pull historical sales, inventory snapshots, purchase orders, and receipt records from your ERP or POS. Most modern systems expose this through a REST API; older on-premise ERPs often require a scheduled flat-file export or an ODBC connection. For SKU profitability tracking, daily is usually the floor, because a weekly snapshot hides mid-week stock-outs that distort margin.
Step 2: Normalize. Your ERP stores SKUs one way; your marketplace another; your 3PL a third. Before any model runs, you need a mapping table that ties every channel identifier back to a single internal SKU. This unglamorous work is where most integrations stall.
Step 3: Enrich. Layer in cost data (landed cost, freight, duties), promotion calendars, and any external signals you trust. Cost data usually lives in your accounting system, not your ERP, so this often means a second integration.
Step 4: Score. The model produces a forecast and a recommended order quantity per SKU per location.
Step 5: Write back. The recommendation goes back into the ERP or purchasing system as a draft purchase order or a reorder alert. This step separates a tool from a report. If the recommendation lives in a dashboard nobody opens, the forecast has no economic value.
Matching the Tool to Your Stack
A few practical patterns:
- Shopify or BigCommerce plus a 3PL: Look for tools with native connectors. The integration is largely configuration, not engineering.
- NetSuite or Dynamics 365: Expect a middleware layer or a vendor with a pre-built connector. Budget for a scoping call before you commit.
- Legacy on-premise ERP: Assume custom work. The forecast quality may be excellent, but the integration cost can exceed the subscription cost in year one.
- Multi-channel with marketplace fees: Confirm the tool can ingest fee data per channel. Without it, the margin picture is wrong at the SKU level even if the demand forecast is right.
Predictive analytics for stock levels only pays off when the forecast reaches a decision. Tools that earn their cost push recommendations into procurement automatically; the ones that do not become another dashboard your team stops opening by month three.
Singuli: Deep Inventory Intelligence for Ecommerce Brands
Singuli is an inventory intelligence platform that applies AI to stock optimization and SKU-level profitability analysis. It is built for ecommerce brands that need to understand margin by product, not just by month.
Its strength is depth. Automated profitability analysis runs at the variant level, and predictive replenishment modeling connects that margin picture to reorder decisions. Integration with major ecommerce platforms means the data pipeline is largely handled for you.
Pros: Specialized focus on inventory profitability; advanced predictive modeling. Cons: Pricing is not publicly transparent, so budget approval takes longer.
Competera: Dynamic Pricing Optimization at Scale
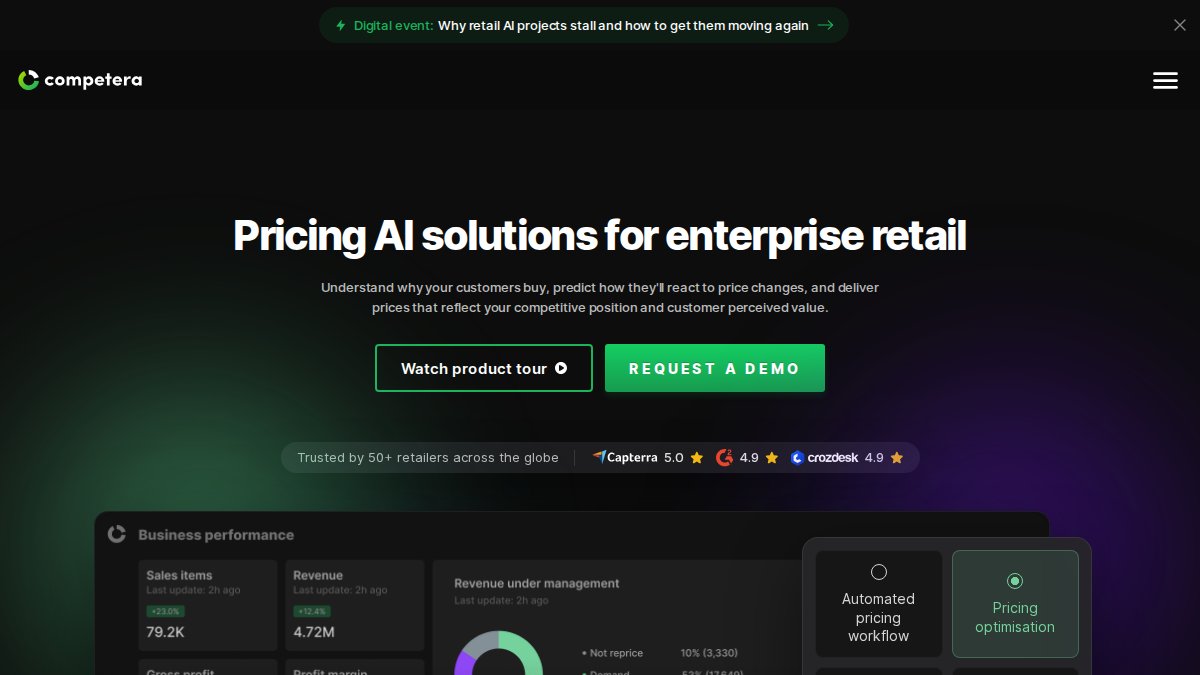
Competera recommends optimal prices and markups across large SKU catalogs using machine learning. Where most tools stop at cost analysis, Competera pushes into pricing strategy.
Real-time competitor price monitoring and automated markup optimization suit retailers where price position drives volume, and cross-category pricing management keeps rules consistent across departments. The trade-off: the platform requires significant data integration before it produces useful output, and it is priced accordingly.
Pros: Handles high SKU counts; strong competitive intelligence. Cons: Heavy integration lift; overkill for small catalogs.
Zoho Inventory: Affordable Entry Point for SMBs
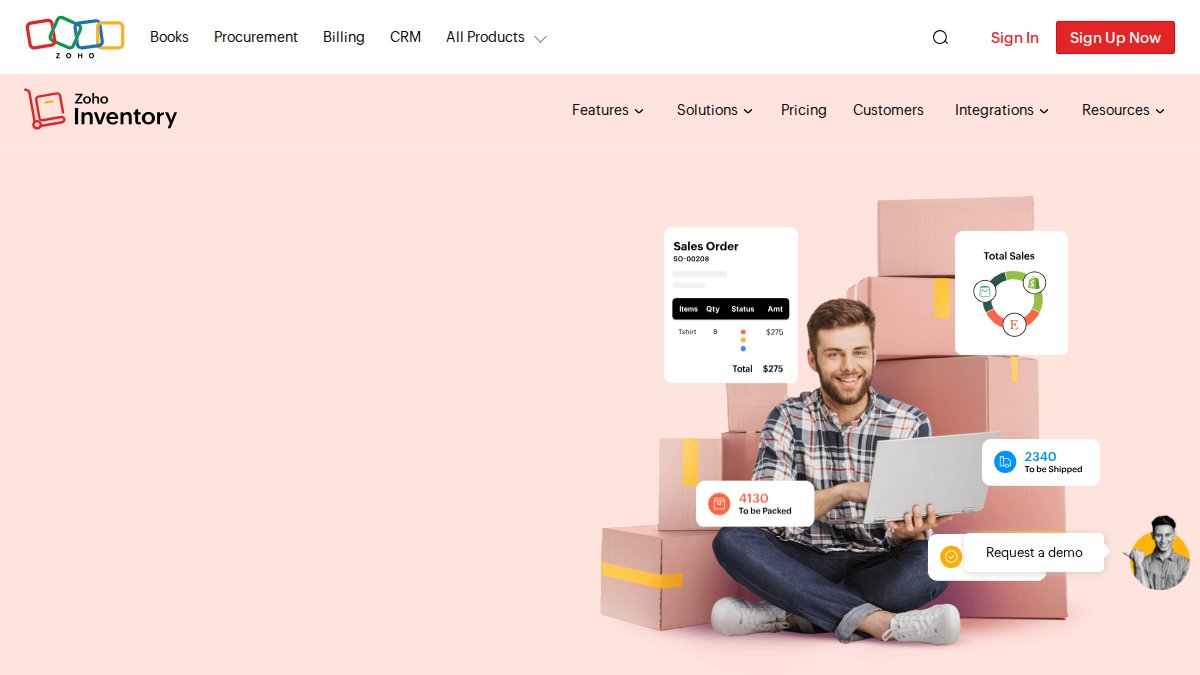
Zoho Inventory is a comprehensive inventory management system with AI-driven workflows for stock and sales tracking. It is the most accessible option here, with a free tier and paid plans starting at $29/month.
Real-time inventory tracking, automated order management, and multi-channel sales synchronization cover the operational basics well. If you already run Zoho CRM or Zoho Books, the native integration is a genuine advantage. The caveat: advanced AI features sit on higher-tier plans, so the entry price is not the full story.
Pros: Affordable entry; seamless Zoho ecosystem integration. Cons: Advanced AI features require higher-tier plans.
Fuelfinance: Financial Planning with SKU-Level Profitability
Fuelfinance approaches the problem from the finance side. It is a financial planning and forecasting tool that provides AI-driven insight into cash flow and SKU-level profitability.
Multi-scenario planning and automated financial reporting make it strong for growth-stage companies that need to model decisions before committing capital. Where it falls short is operational inventory management: Fuelfinance will tell you what a SKU contributes to the P&L, but not what to reorder tomorrow.

Pros: Comprehensive financial planning; ideal for growth-stage companies. Cons: Less focused on operational inventory management.
The tools above solve parts of the problem.
Scale Partners AI takes a different route. We build custom, production-ready systems around the stack you already run, with no rip-and-replace and no loss of historical data. You get real-time visibility into true per-SKU profit, AI-flagged bundling opportunities that lift margin, and weekly fix-this recommendations your team can implement rather than file away. With 15 years of operator experience behind the work, the systems run in production, not in slide decks.
Book a Discovery Call with Scale Partners AI and get your first weekly recommendation set in front of the people who can act on it.
Frequently Asked Questions
What is SKU profitability and why does it matter?
SKU profitability measures the net profit each product variant generates after subtracting all associated costs: cost of goods sold, shipping, storage, returns, and marketing. It matters because high-revenue SKUs can actually lose money once fulfillment and carrying costs are included. Tracking per-SKU profit reveals which products deserve more inventory investment and which ones quietly erode your margins, enabling smarter procurement and pricing decisions.
How does AI improve SKU-level profitability analysis?
AI tools process historical sales trends, real-time sales data, and inventory carrying costs to calculate true per-SKU profit at scale. They flag underperforming SKUs, suggest bundling opportunities, and automate reporting that would take hours manually. AI also supports demand forecasting and dynamic pricing, helping prevent stock-outs and over-ordering. The result is data-driven decision making that improves inventory turnover and overall supply chain efficiency.
Can AI tools automate SKU rationalization?
Yes. AI tools can analyze each SKU's gross margin, inventory velocity, and channel-level performance to recommend which products to discontinue, keep, or bundle. They continuously monitor KPI monitoring metrics and alert you when a SKU's profitability drops below thresholds. However, human judgment is still needed for strategic decisions like brand positioning or supplier relationships. The best approach combines AI-driven insights with operator oversight.
How do I choose the right inventory profitability software?
Start by mapping your current data sources and integration needs. If you run multi-channel ecommerce, look for tools that sync with your sales channels and warehouse systems. Check whether pricing is transparent and if the tool offers a free tier or trial. Consider scalability: will it handle your SKU count and order volume as you grow? Finally, evaluate the cost-benefit of AI adoption, including implementation time and training. A discovery call with a vendor can clarify fit.
What are the key metrics to track for SKU profitability?
Track gross margin per SKU, inventory turnover rate, carrying costs, stock-out frequency, and return rate. Also monitor channel-level profitability if you sell across multiple platforms. These metrics feed into profitability modeling and help you identify underperforming SKUs. Automated reporting tools can surface these numbers weekly, so you spend less time compiling data and more time acting on it.